

meta data for this page
Components Menu
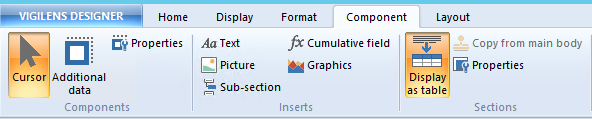
Components
Cursor
 Allows you to deselect a previously selected tool
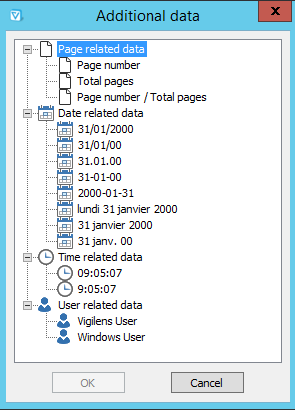
Addtionnal Data

After clicking this button, select an area on the report to add a field such as the page number, the date or time of the day of printing, or the name of the user.
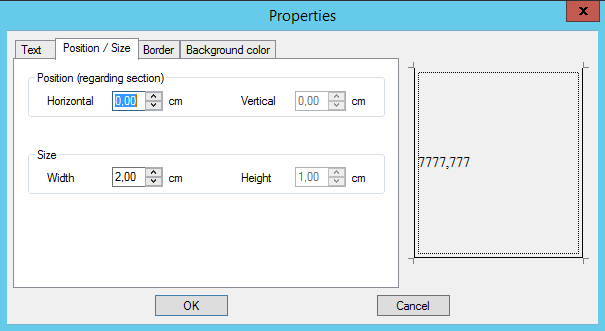
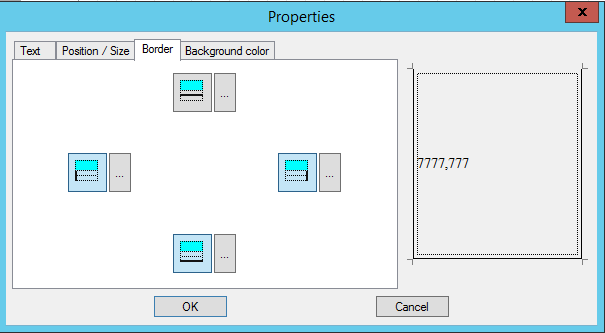
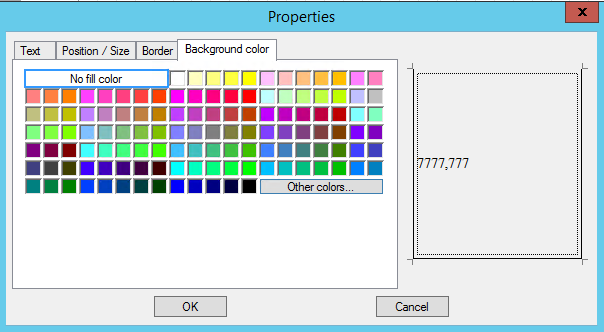
Properties

Gives access to all the parameters of the selected object.
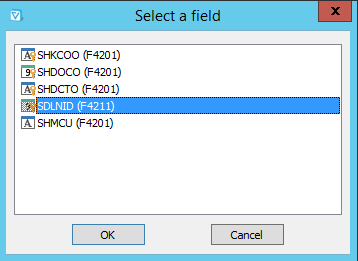
For a field
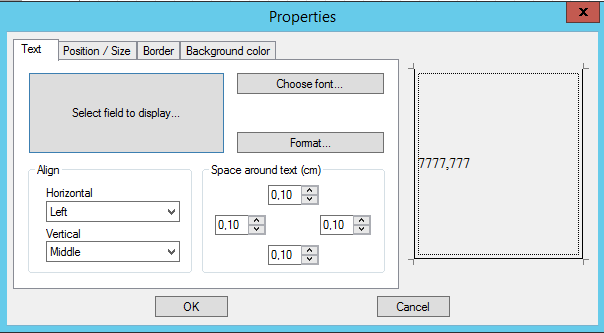
The Select field to display button is used to select/modify the field :
For a section
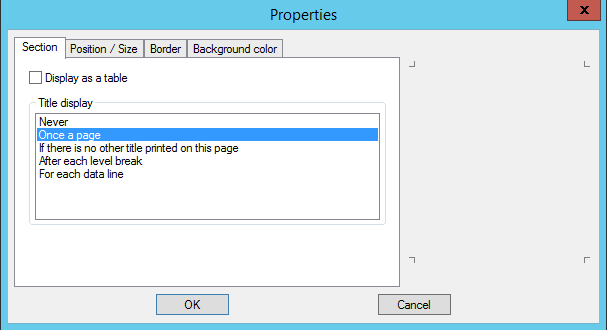
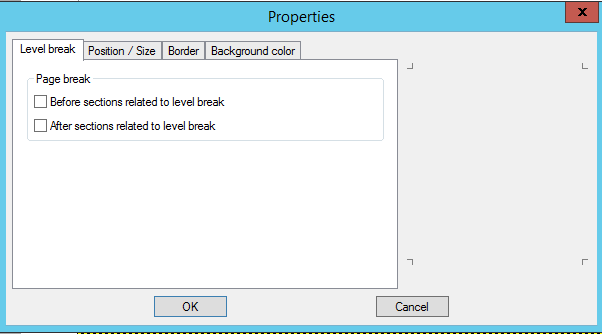
In the properties of a section, in addition to the classic Position/Size, Border and Background color tabs, there is the Section tab, which allows you to manage page breaks and titles display.
This tab is not available for all section types
Allowed options depend on the section type.
for Body section:
for Level break header:
Inserts
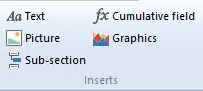
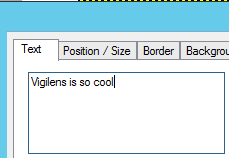
Text
 Allows the addition of a static label on the report.
This type of object has the same properties as a field, except that the label is typed while fields are chosen in a list.
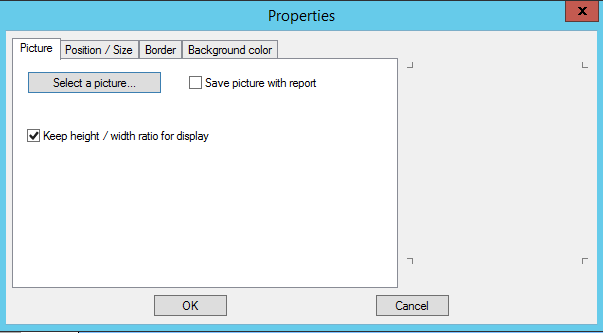
Picture

Allows you to add an image. This image can either be left on the server or incorporated into the report. In the properties of a sub-section, in addition to the classic Position/Size, Border and Background tabs, there is a Picture tab, which gives access to the specific properties of this type of object.
Sub-section

At the time of report construction, it is possible to add a sub-section with data from another report.
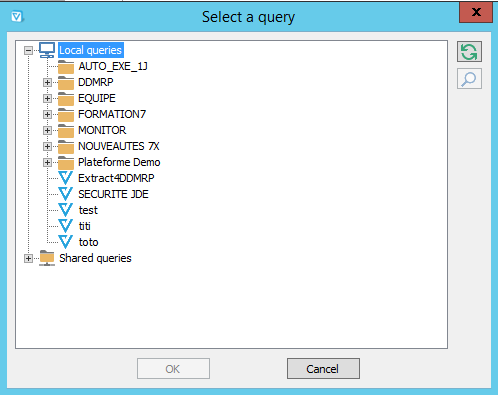
After clicking the Subsection button, a location on the report design must be selected. Vigilens then asks which query should be called.
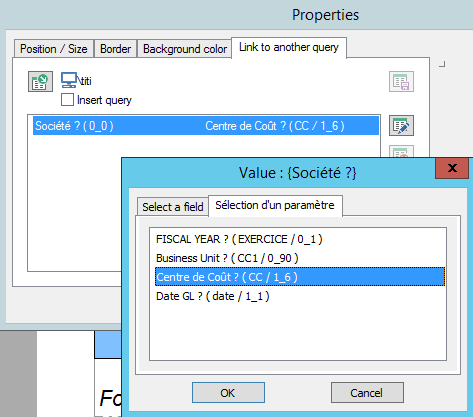
In the properties of a sub-section, in addition to the classic Position/Size, Border and Background color tabs, there is the Link to Another Query tab. It allows you to change the query called by the sub-section and to specify the values of the parameters when calling this subquery.
Cumulative field
After clicking the Cumulate button, select a location on the report design.
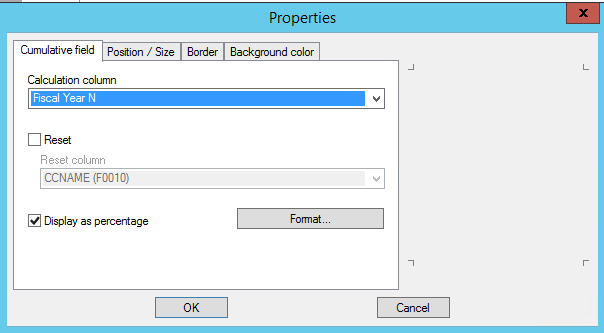
In the properties of a sub-section, in addition to the classic Position/Size, Border and Background color tabs, there is the Cumulative field tab that allows you to specify the field that will be the object of the cumulation, as well as the break conditions that resets total amount to zero.
Graphics
After clicking on the  button, you have to choose a field of the report and then a data type.
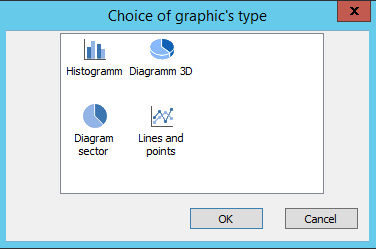
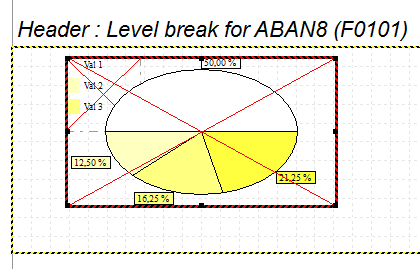
A diagram symbolizes the location of the graph on the report.
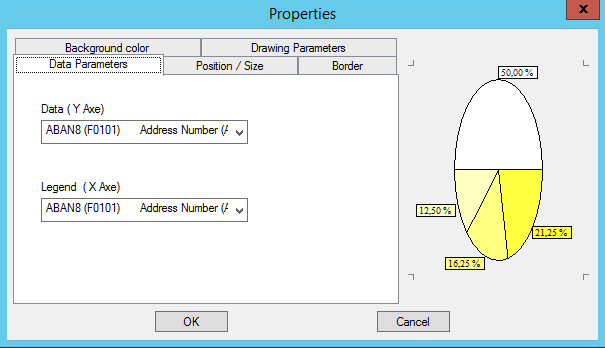
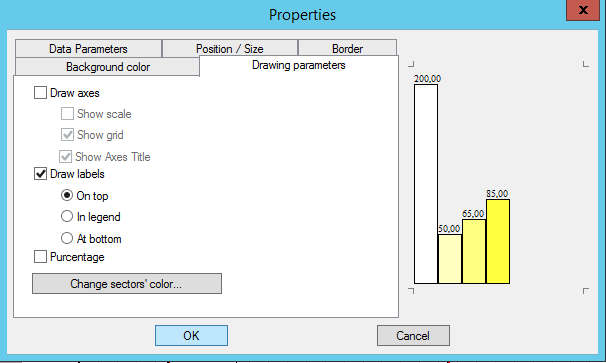
In the properties of a Graphic, in addition to the classic Position/Size, Border and Background color tabs, there are two additional tabs : Data Parameters and Drawing parameters.
Sections
Display as table
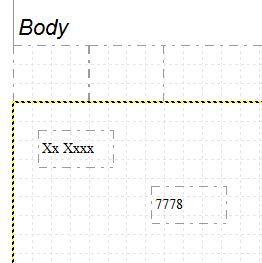
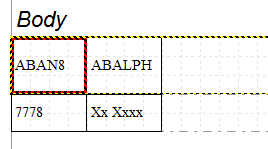
A section can be structured either as a table or as a free layout. In free layout, fields and labels can be freely arranged. In table mode, the data will be displayed as a table in columns with headers.
Free layout:
Display as table:
Copy from main body
Properties

Even if the object selected is not a section, this button will open properties window of the section it belongs to.